eZ Server Monitor alternatives and similar tools
Based on the "Monitoring" category.
Alternatively, view eZ Server Monitor alternatives based on common mentions on social networks and blogs.
-
-
-
-
-
Healthchecks
Open-source cron job and background task monitoring service, written in Python & Django -
-
-
Vector
DISCONTINUED. Vector is an on-host performance monitoring framework which exposes hand picked high resolution metrics to every engineer’s browser. -
Zabbix
Real-time monitoring of IT components and services, such as networks, servers, VMs, applications and the cloud. -
-
-
-
-
-
-
-
-
-
-
-
Statping-ng
An updated drop-in for statping. A Status Page for monitoring your websites and applications with beautiful graphs, analytics, and plugins. Run on any type of environment. -
Flapjack
Monitoring notification routing + event processing system. For issues with the Flapjack packages, please see https://github.com/flapjack/omnibus-flapjack/ -
Thruk
Thruk is a multibackend monitoring webinterface for Naemon, Nagios, Icinga and Shinken using the Livestatus API. -
-
AS-Stats v1.6 (2014-09-12)
A simple tool to generate per-AS traffic graphs from NetFlow/sFlow records -
-
OMD
OMD - Open Monitoring Distribution Labs Edition. Der deutschsprachige Open-Source-Monitoring-Workshop findet am 16./17.5.2024 in Neckarsulm statt. https://discord.gg/jDfPZ63FcJ -
Centreon
Centreon is a network, system and application monitoring tool. Centreon is the only AIOps Platform Providing Holistic Visibility to Complex IT Workflows from Cloud to Edge. -
-
SWMP - Server Web Monitor Page
DISCONTINUED. A responsive, eye-pleasing Linux server statistics dashboard. -
-
-
-
-
EdMon
A command-line monitoring application helping you to check that your hosts and services are available, with notifications support. MIT Java

InfluxDB - Power Real-Time Data Analytics at Scale


* Code Quality Rankings and insights are calculated and provided by Lumnify.
They vary from L1 to L5 with "L5" being the highest.
Do you think we are missing an alternative of eZ Server Monitor or a related project?


README
eZ Server Monitor (eSM) is a script for monitoring Linux servers. It is available in Bash version and Web application.
eZ Server Monitor `Web
In its Web version eSM is a PHP script that displays on a Web page information such as:
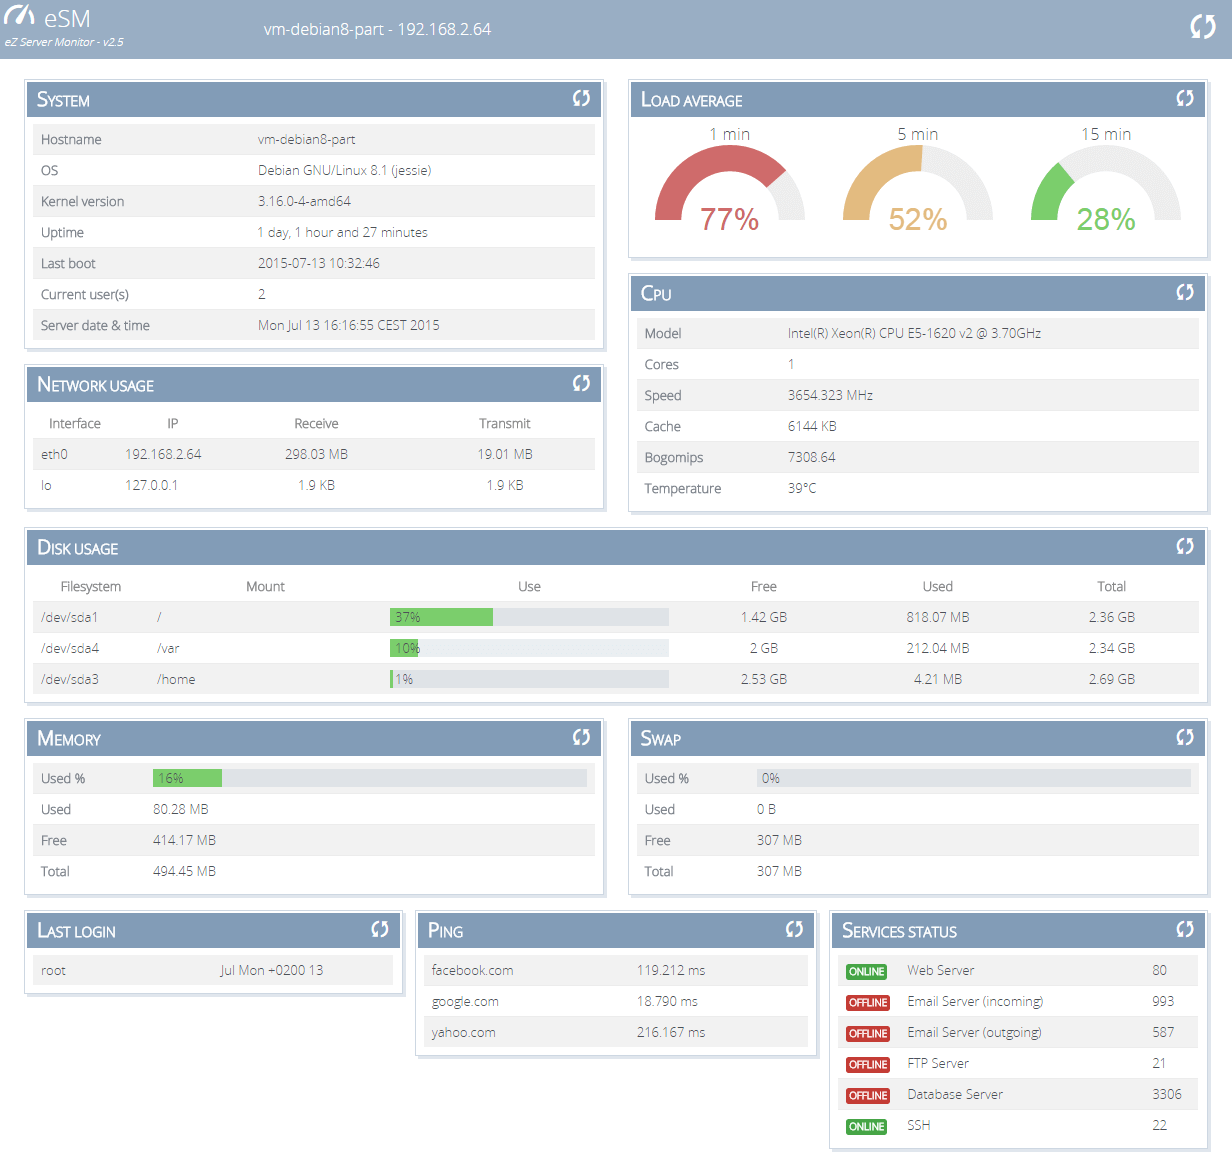
- System : hostname, OS, kernel version, uptime, last boot date, number of current user(s), server datetime
- Load average : gauges showing the CPU load with the percentage (1 minute, 5 minutes et 15 minutes)
- Network usage : displaying the IP address of each network interface with the data transmitted and received
- CPU : model, frequency, cores number, cache L2, bogomips, temperature
- Disk usage : table of each mount point with the space available, used and total
- Memory : table containing the available used and total of RAM
- Swap : table containing the available used and total of Swap
- Last login : display last 5 user connections
- Ping : ping the hosts defined in the configuration file
- Services : displays the status (up or down) services defined in the configuration file
Several themes are available !

Each block can be reloaded manually.
You can download the last version here. The requirements are simple : a Linux environment, a web server (Apache2, Lighttpd, Nginx, ...) and PHP.
The documentation explains all the parameters of esm.config.json.
Changelog is available here.
View more information on the official website.